dashy-dash
Live · sign-in requiredMy self-hosted training diary: Garmin, the Strava export and Wahoo in one database, with health data, goals and planning.
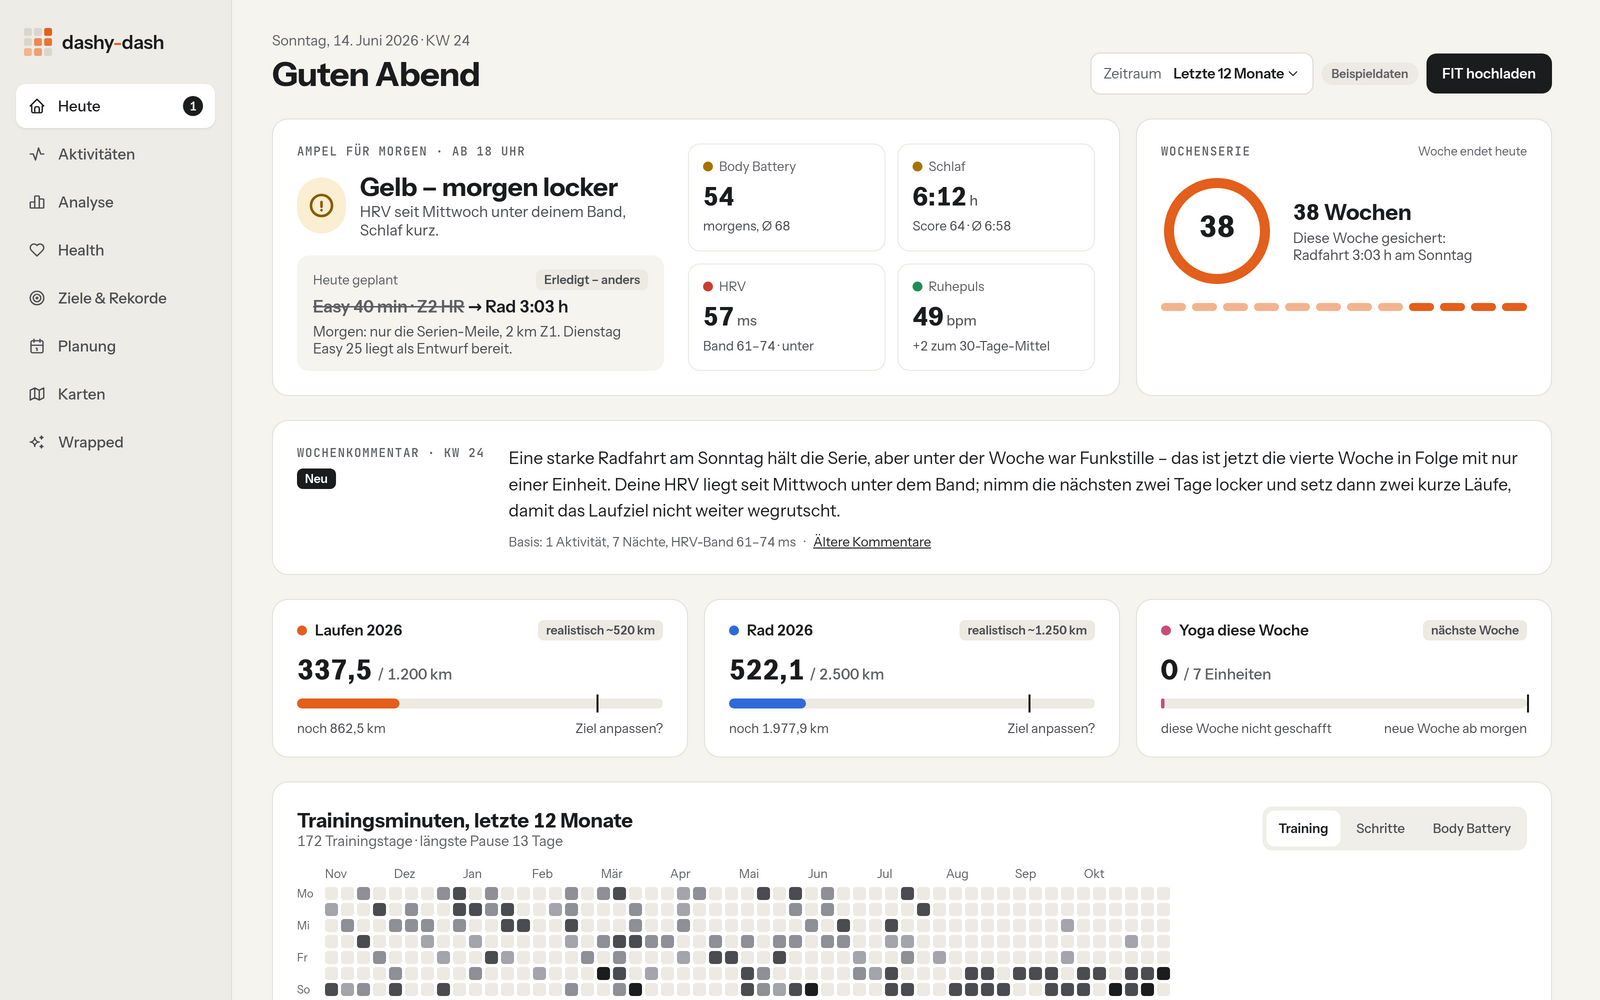
My training data lived in three places: eleven years on Strava, the Garmin watch since 2024, and rides on the Wahoo as well. The analyses I wanted were only available with a Strava subscription, and a program I built myself had no official way to reach my own Garmin data. That changed in October 2026: since then Garmin gives everyone a personal key for their own data in Garmin Connect.
With it, dashy-dash fetches activities every hour, including the original files, and daily values such as sleep, resting heart rate and recovery. It reads the Strava export once and accepts rides from the Wahoo as files. From all that it works out goals, streaks and reviews for the month and the year, a traffic light for whether to train easy or hard, and the weather on every activity with GPS, going back to 2015. Weekly plans come from fixed rules; an AI writes a comment on the week every Monday and plans single sessions on request. A plan only goes to the watch once I approve it.
I planned dashy-dash on 25 October 2026 and built it on the 26th and 27th, in German and English. It runs on my own server, just for me. The weekly comment, the planning and sending plans to the watch are built; only their access is still missing. The pictures on this page come from the design draft; every value in them is made up. dashy-dash is built so that anyone could run it with their own Garmin key; the repository is private for now, though it may become open later.
Decisions
Strava only through my own export
The Strava API would have been the easy route. But it is only open with a subscription, allows data to be kept for seven days at most and forbids passing it to an AI. For a diary that reaches back years and writes weekly comments, that rules it out. Downloading your own account export, on the other hand, is not use of the API: it is read in once, and everything new comes from Garmin afterwards.
One version per session, nothing stitched together
dashy-dash recognises the same session by sport and a start time within two minutes, or by two recordings overlapping by more than 80 per cent. The obvious idea would be to combine the best of every version, say the track from the bike computer and the heart rate from the watch. But then no number could be traced back to a single recording. So exactly one version is kept: for rides the one from the Wahoo, otherwise the one from Garmin. Only titles, notes and tags may come from any source.
Keep the raw data; the database is only derived
Every original file and every response from Garmin is kept unchanged, and the database next to it is just a derived snapshot. If a calculation gets better later or a bug in the import turns up, everything is rebuilt from the archive without asking Garmin again. SQLite is enough as the database: one file instead of a separate database server, often even faster for one person, and one container fewer for anyone who wants to run it themselves.
Count the tiles, but do not show them all
As is common among cyclists, the map counts the map tiles a route passes through. Showing every tile with its number of visits would give away the flat: the tile around the front door would have the most visits, and a hole left in that spot would mark it just as clearly. So everything is counted, but no tile is shown that a route only touches in its first or last 300 metres, and none carries a visit count. The tile at the front door still appears, because you almost always cross it further along the way as well.
Colour belongs to the data
A dark cockpit with a dense display was rejected: tiring on a phone, and the shareable reviews would have been hard to export from it onto a light background. The interface is light, its buttons are graphite grey, and only the data gets colour. Colour never carries a meaning on its own: every sport also has a symbol, the traffic light a symbol and a word, so everything stays readable with red-green colour blindness.